

Energy
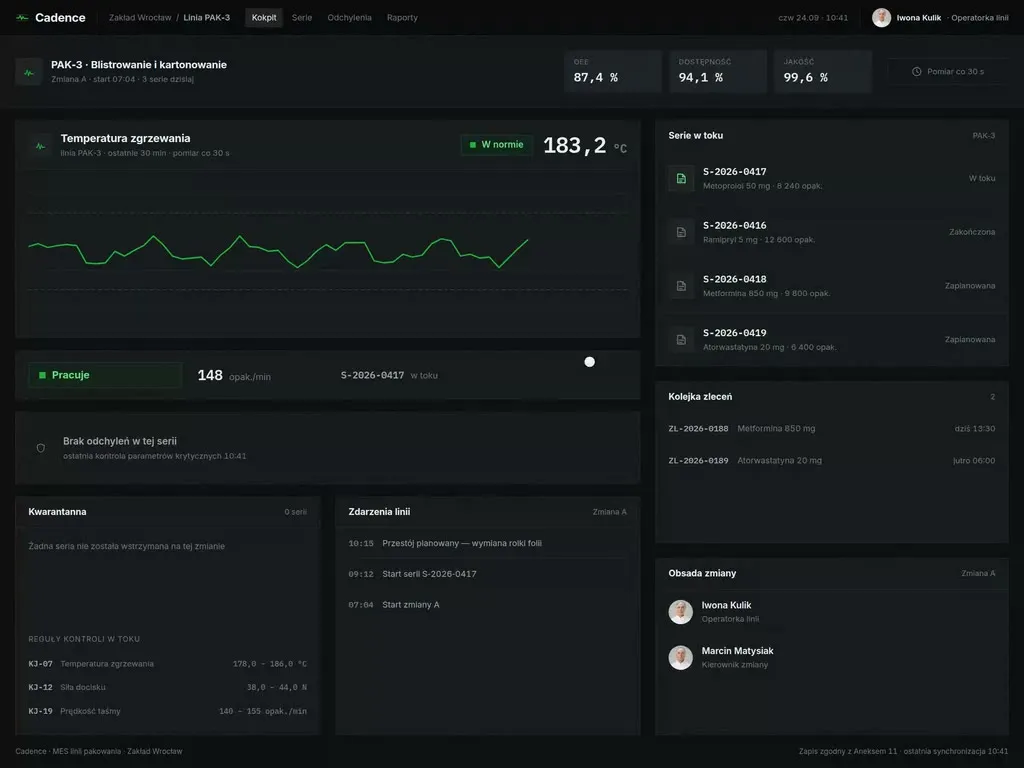
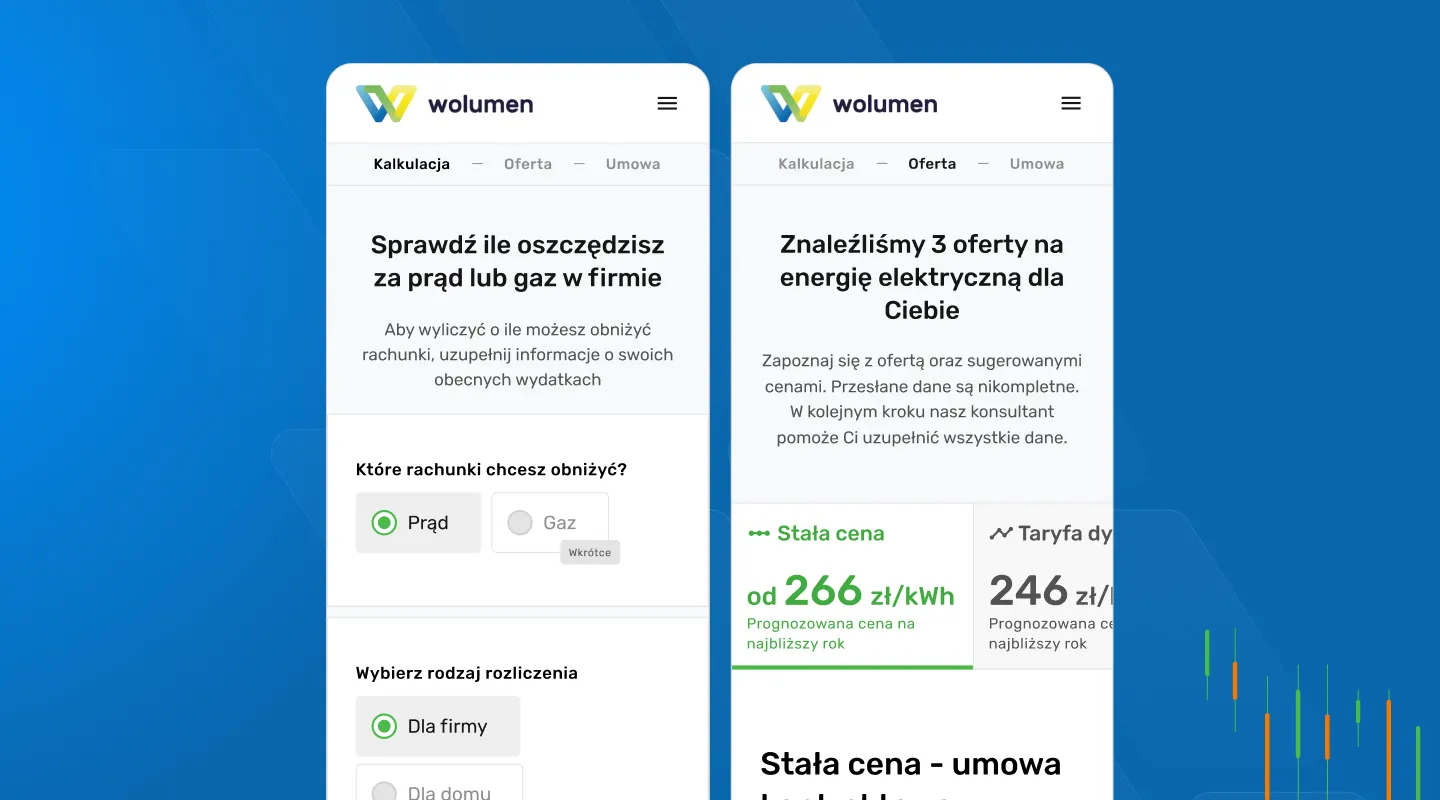
At Wzór UX agency you receive an interactive design of your energy software, be it a customer portal, a quote calculator or a dispatcher panel, and either our team or your own developers can then build it. That is how the quote calculator in Wolumen, an energy and gas price comparison service for businesses, came about.







Challenges
What challenges do we help solve in the energy sector?
Our approach
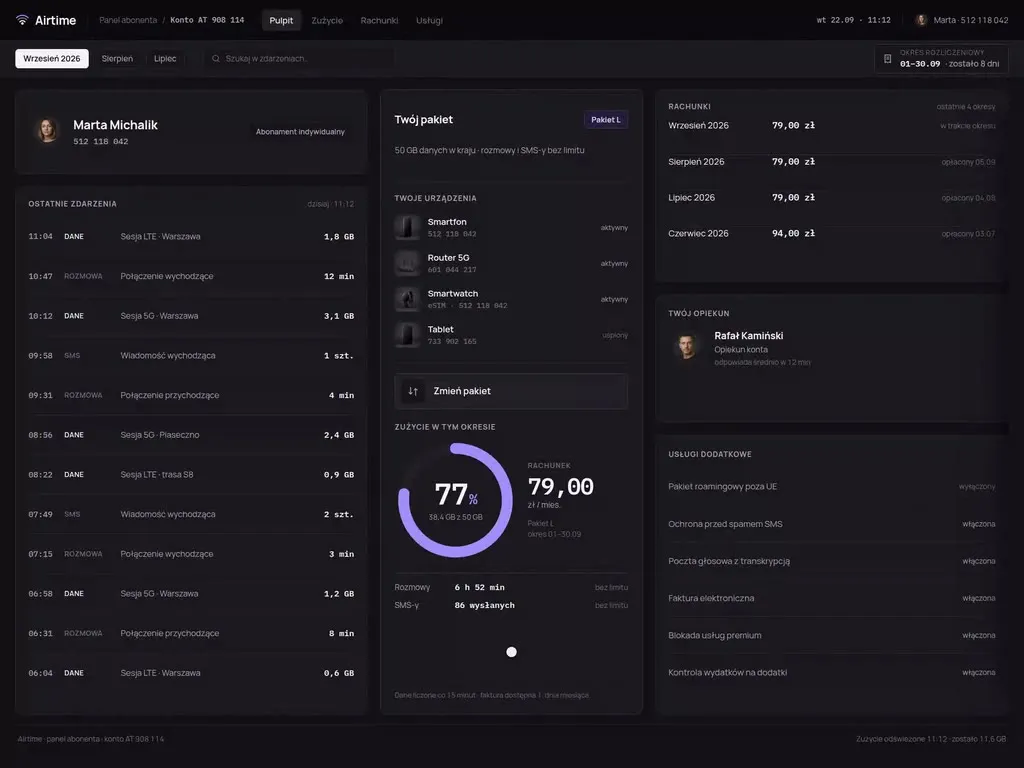
In the customer portals we design, we break the invoice down into what the customer actually pays for: energy, distribution and the difference between the estimate and the meter reading, with one line of explanation next to each item. We state a correction as an amount and a reason before the customer reaches for the phone.
Scope of services
Our approach
In a quote calculator we first ask for what the customer has to hand, meaning the bills and the type of settlement, and they fill in whatever they do not know by heart later, with a consultant. The Wolumen comparison service has this layout, and its form used to have more than a hundred fields.
Scope of services
Our approach
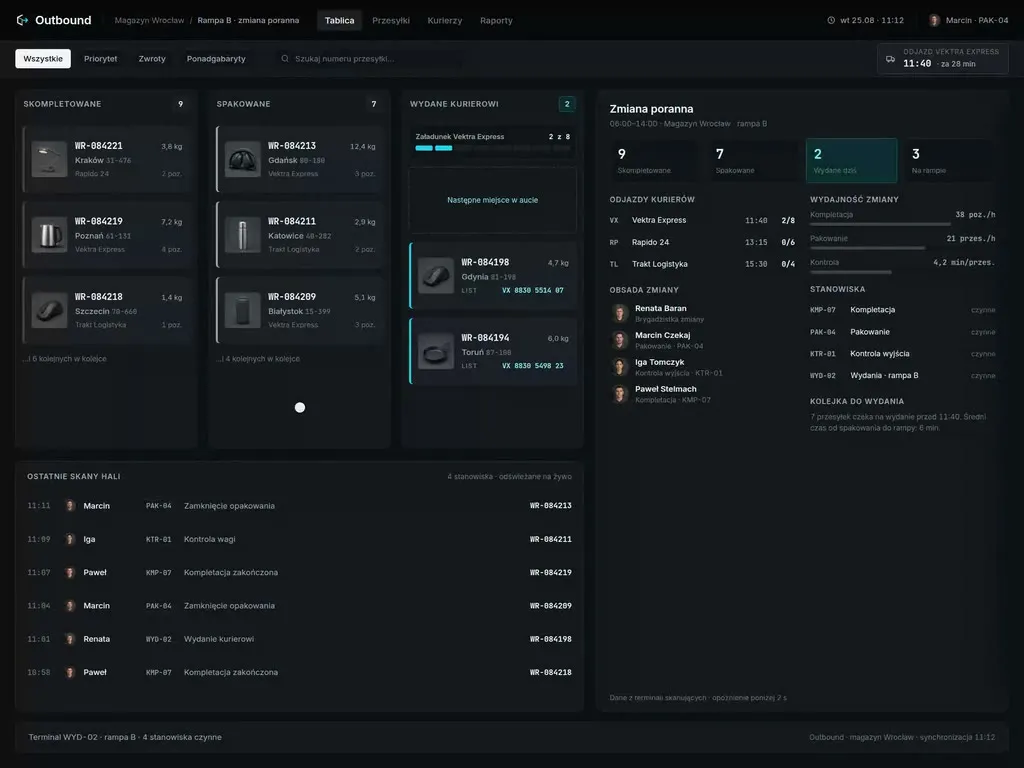
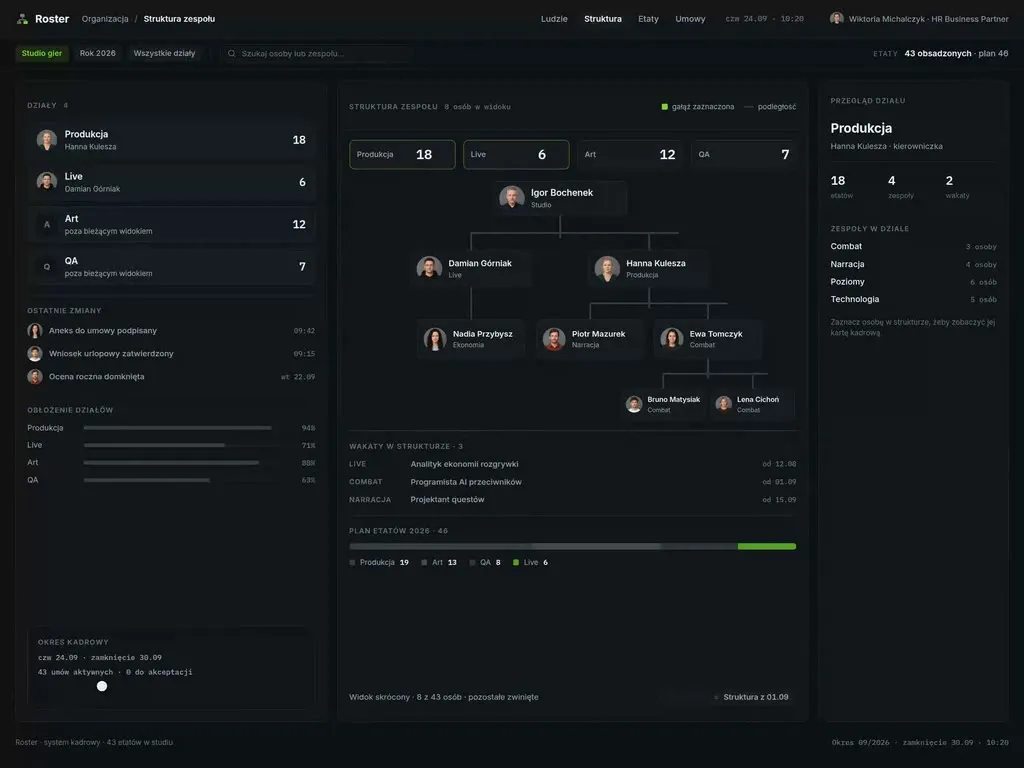
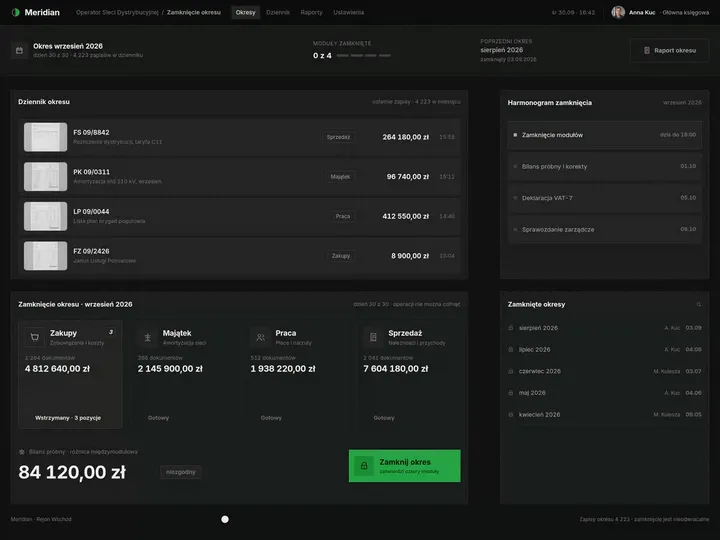
On the outage board we design, we gather the alarms from one outage into a single event: the line, the number of customers without power and the nearest available crew. The dispatcher starts from the decision and opens individual SCADA signals only when they need them.
Scope of services
Who it is for
Which energy companies do we design software for?
Quote calculators and online contracts
Energy suppliers and energy brokers take the customer from a quote to a signed contract, and a business customer drops out at every question they cannot answer. We designed Wolumen, an energy and gas price comparison service for businesses, so that the quote, the offer and the contract follow one another and the customer compares a fixed price and a dynamic tariff side by side. After launch Wolumen reported higher conversion and a lower load on its customer service office.
Customer portals and apps for energy customers
An energy customer uses the supplier's customer portal to submit a meter reading, pay an invoice and check consumption, and a prosumer also looks at the energy fed into the grid. Designing one for a supplier, we put the invoice and payment on the first screen and keep changes to details or the contract one click further away.
Billing systems and customer service desks
A customer service consultant at a supplier or an operator searches the billing system, SAP IS-U for example, for readings, estimates and corrections from several periods before explaining an invoice to the customer. We lay out the consultant's screen to separate what they can close during the call from what they have to pass on to the billing department.
Grid connection portals
Distribution system operators receive connection applications and micro-installation notifications through a grid connection portal, with the investor attaching the inverter details and the installer's declaration. In the portal we design for grid operators, the status of every application is visible from notification to contract, so the installer and the investor do not have to phone the operator to ask what happens next.
SCADA, ADMS and outage management
A distribution grid dispatcher runs the network in SCADA and ADMS for the whole shift and, during an outage, coordinates the crews and answers questions from the helpline. Our work covers what they look at next to the network diagram: the outage board, the crew work orders and the message the helpline consultant is reading at the same moment.

Why us?
Why choose our UX agency?
-
Fewer applications sent back
A grid connection portal that checks a notification for completeness before it is sent hands operator staff cases that are ready to assess. The connections team gets back the time that goes into chasing missing documents today.
-
Shorter calls in customer service
A consultant who sees the reading, the estimate and the correction on one timeline explains the invoice in the first call, without calling back. The same team then handles more cases without extra headcount.
-
New offers without rebuilding screens
We design tariffs, prices and contract terms in the calculator and the customer portal as interchangeable parts. A new offer or a tariff change then means entering data, not designing the screens again.
-
A senior team
A team of senior UX designers who have been designing interfaces for nine years, today for large organisations, SaaS companies and software houses. Seniors will take on your customer portal or dispatcher panel, from discovery in customer service to sign-off.
-
Proven client trust
We have designed for 115 brands, and most of them come back to us with their next project.
-
Higher quality with AI
A designer with AI tools checks more variants of an invoice view or an outage board than they could draw by hand and picks the one that works. What reaches you is a tested version, not the first one that came out.
Process
How will we design your energy software, step by step?
-
A conversation with your team

We set the goals and look at the systems you run on today
We sit down with the people responsible for customer service, billing, grid connections or network dispatch. Together we pick the process to change, list the systems the project has to work with and agree how you will know it has worked.
Key steps
- Conversations with customer service, billing and dispatch managers
- A review of the systems: billing, customer portal, CRM, SCADA
- Choosing the process we start with
- Agreeing the measures: calls after an invoice, complete applications, case handling time
Deliverables
- Project brief
- Map of systems and their owners
- List of measures
- Scope of the first stage
-
Discovery in customer service and the control room
We watch the work at the desks, not in the documentation
We listen to helpline calls after invoices go out, sit with a dispatcher on shift and go through a micro-installation notification with an installer. We note the workarounds: a spreadsheet kept open beside billing, a note with the crews' phone numbers, a call to the operator instead of a status in the portal.
Key steps
- Listening to helpline calls
- Observing a shift in the control room
- Going through a notification with an installer
- Interviews with customers and prosumers
- A review of invoice complaints
Deliverables
- Research report
- Process map with workarounds
- Prioritised list of problems
-
Interactive system design
A design that customers, consultants and dispatchers click through
The screens are designed straight for the target devices: the customer's phone, the consultant's desk, the monitors in the control room. We test the prototype on sample invoices and outage scenarios and make the changes before it goes to the developers.
Key steps
- Screen architecture by role: customer, prosumer, consultant, installer, dispatcher
- Interactive design for the target devices
- Exception states: missing reading, correction, outage, case sent back for completion
- Prototype tests with users
Deliverables
- Interactive design of every screen
- Component library
- Description of behaviour in exceptions
- Prototype test report
-
Build or design hand-off
The new screens reach your systems together with the integrations
Our team builds the design, or we hand it over to your developers or to your system vendor. Either way, we spell out where each screen takes its data from: the billing system, smart meters, CSIRE or SCADA, so that the rollout does not stop invoicing.
Key steps
- Screen and field specification for developers
- Integration map: billing, CRM, meter data, CSIRE, SCADA and ADMS, payments
- Support for the implementation team
- Tests on test data before launch
Deliverables
- A working system or a package ready to build
- Integration specification
- Pre-launch test report
-
Measuring after launch
We check against customer service data whether the change worked
After launch we compare calls after an invoice, the share of applications sent back for completion and case handling time with the measurement taken before the change. That comparison sets the order of the next improvements.
Key steps
- Measuring helpline contacts after invoices go out
- A review of applications sent back for completion
- Conversations with consultants and dispatchers after launch
- Plan for the next improvements
Deliverables
- Measurement report
- Prioritised list of improvements
- System development plan
Methods and technologies
Systems and standards we work with in the energy sector
-
SAP IS-U
When a supplier bills its customers in SAP IS-U, the data behind one invoice sits in several places in the system: the contract, the readings and the billing documents. In that setup we agree with your SAP team from the first meeting which fields can be shown outside the system and which need a change in SAP IS-U itself.
-
CSIRE
CSIRE has been live since 1 July 2025, and suppliers and operators use it to handle energy market processes such as switching supplier, joining it in stages. On customer-facing screens we describe the status of a supplier switch handled through CSIRE in sentences that someone who has never heard of CSIRE can follow.
-
Smart meters
Smart meters, which operators are installing at customers' premises, send detailed consumption data instead of a single reading per billing period. We draw them in the self-service portal as a chart of the household's day instead of a table of numbers.
-
SCADA and ADMS
When outage information from SCADA and ADMS does not reach the helpline or the customer portal, customers phone in and the consultant knows less than the dispatcher. From the views next to the dispatch system we pass the outage status on, so that the helpline and the person at home know what the control room knows.
-
Net-billing
Net-billing, under which since 1 April 2022 the energy a prosumer feeds into the grid has been settled by value, in zloty, is something the prosumer checks on the invoice and in the app. We write the invoice and the app in one language, so every figure on the invoice can be found in the app.
-
Test invoices
Test invoices with fictitious customers but real tariffs and corrections are what we use to test the customer portal and the consultant's screen. Test participants see a settlement just like their own, and no customer personal data leaves the company.
Selected work
Our work for energy and industry
The energy and gas price comparison service for businesses is a project for the energy market. The other projects are websites, a brochure and a visual identity for industrial companies, including a steel structure manufacturer working for industry and energy.
-
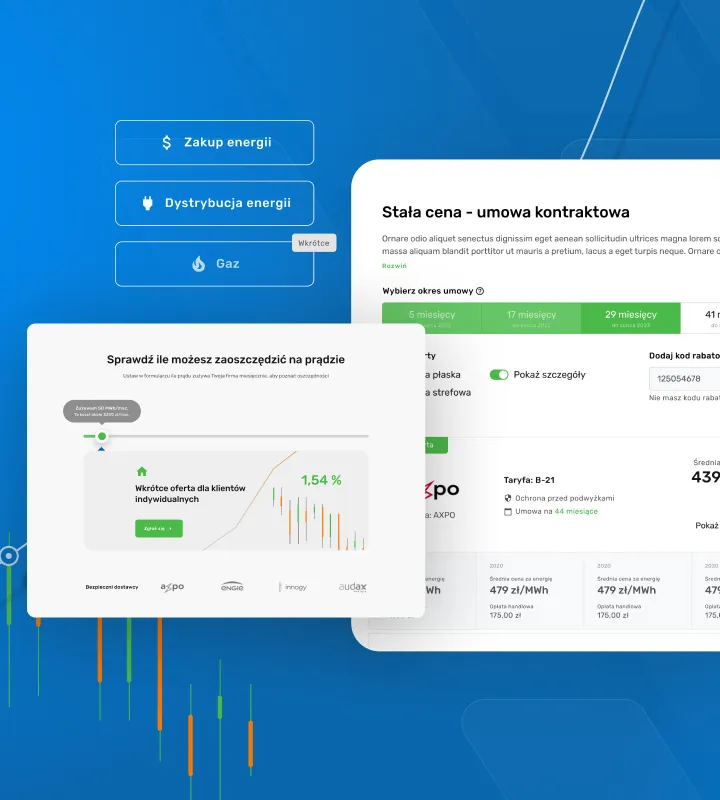
Energy
Wolumen
Read case studyWolumen's form had over 100 fields. After launch the client reported higher conversion and a lower load on the Customer Service Office.
-
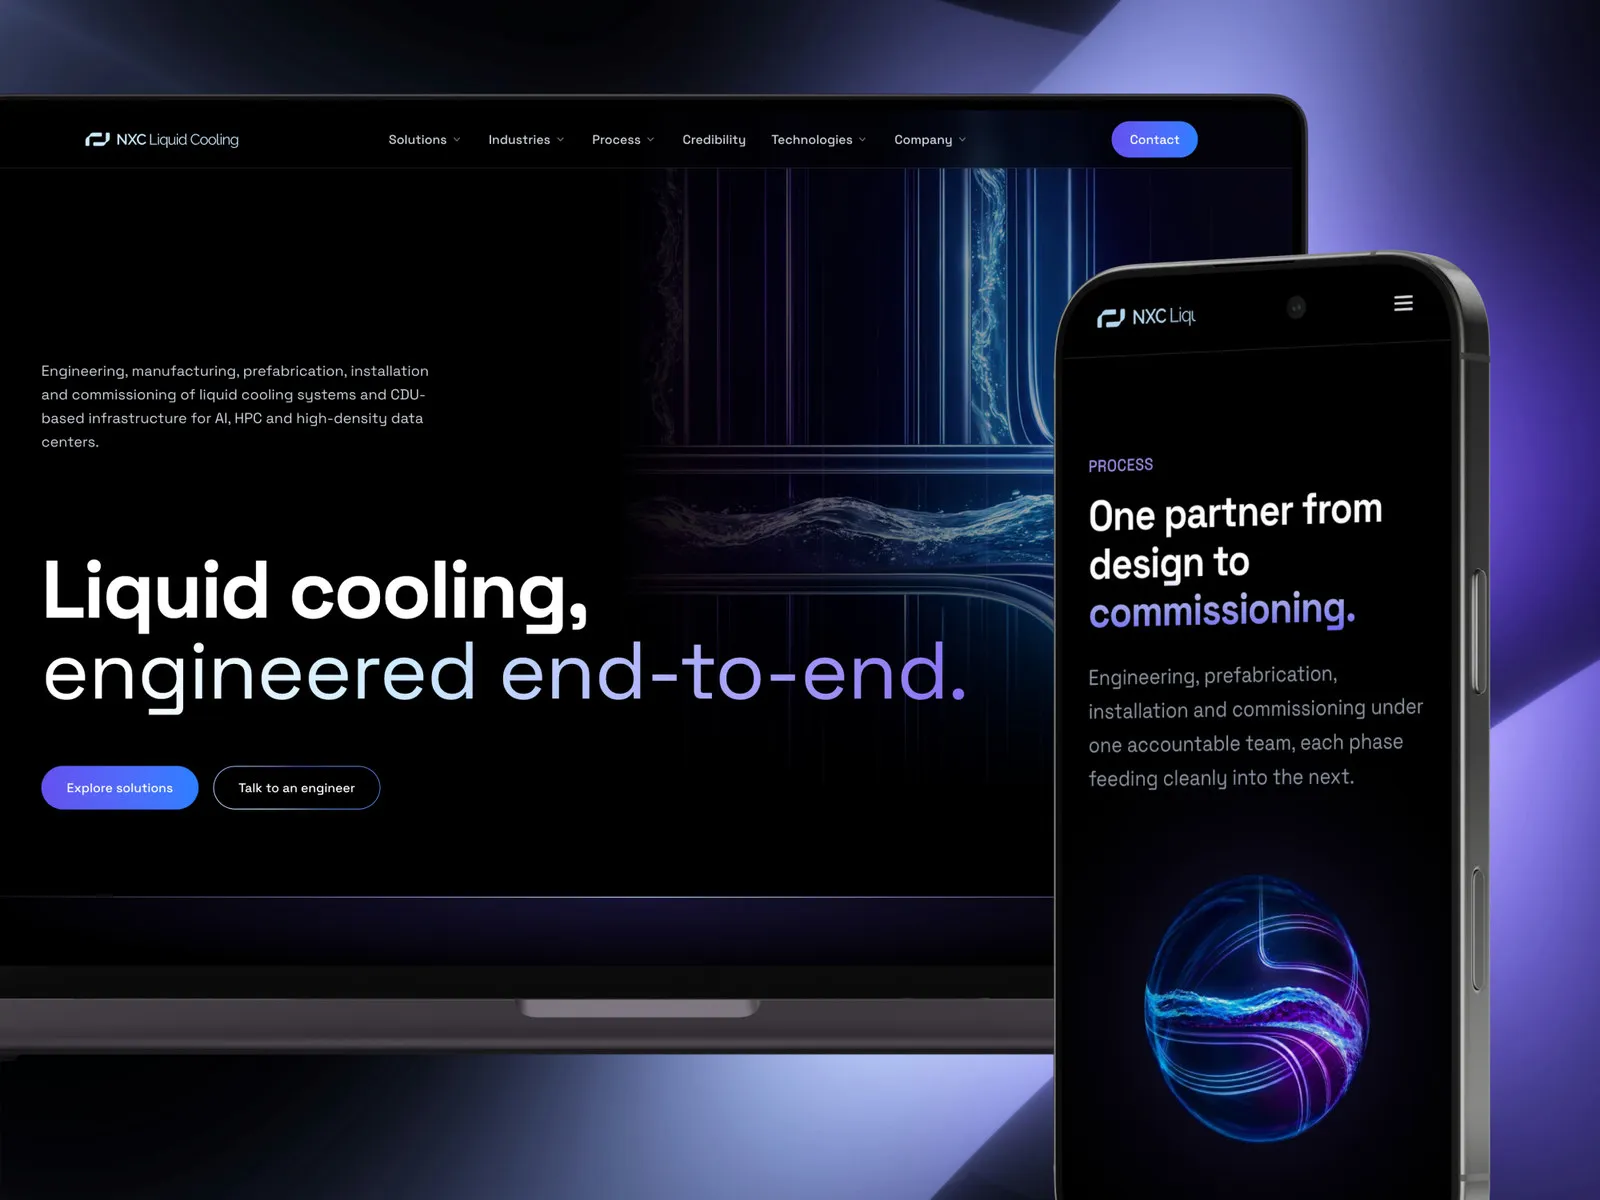
Industrial Manufacturing
NXC Liquid Cooling
View projectThe website of NXC, a Wrocław company that engineers, prefabricates, installs and commissions liquid cooling systems and CDU-based infrastructure for AI and HPC data centers. A dark interface set in Space Grotesk, twenty pages across four cross-sections - solutions, industries, process, technologies - and English copy written for an engineer rather than for a search engine.
-
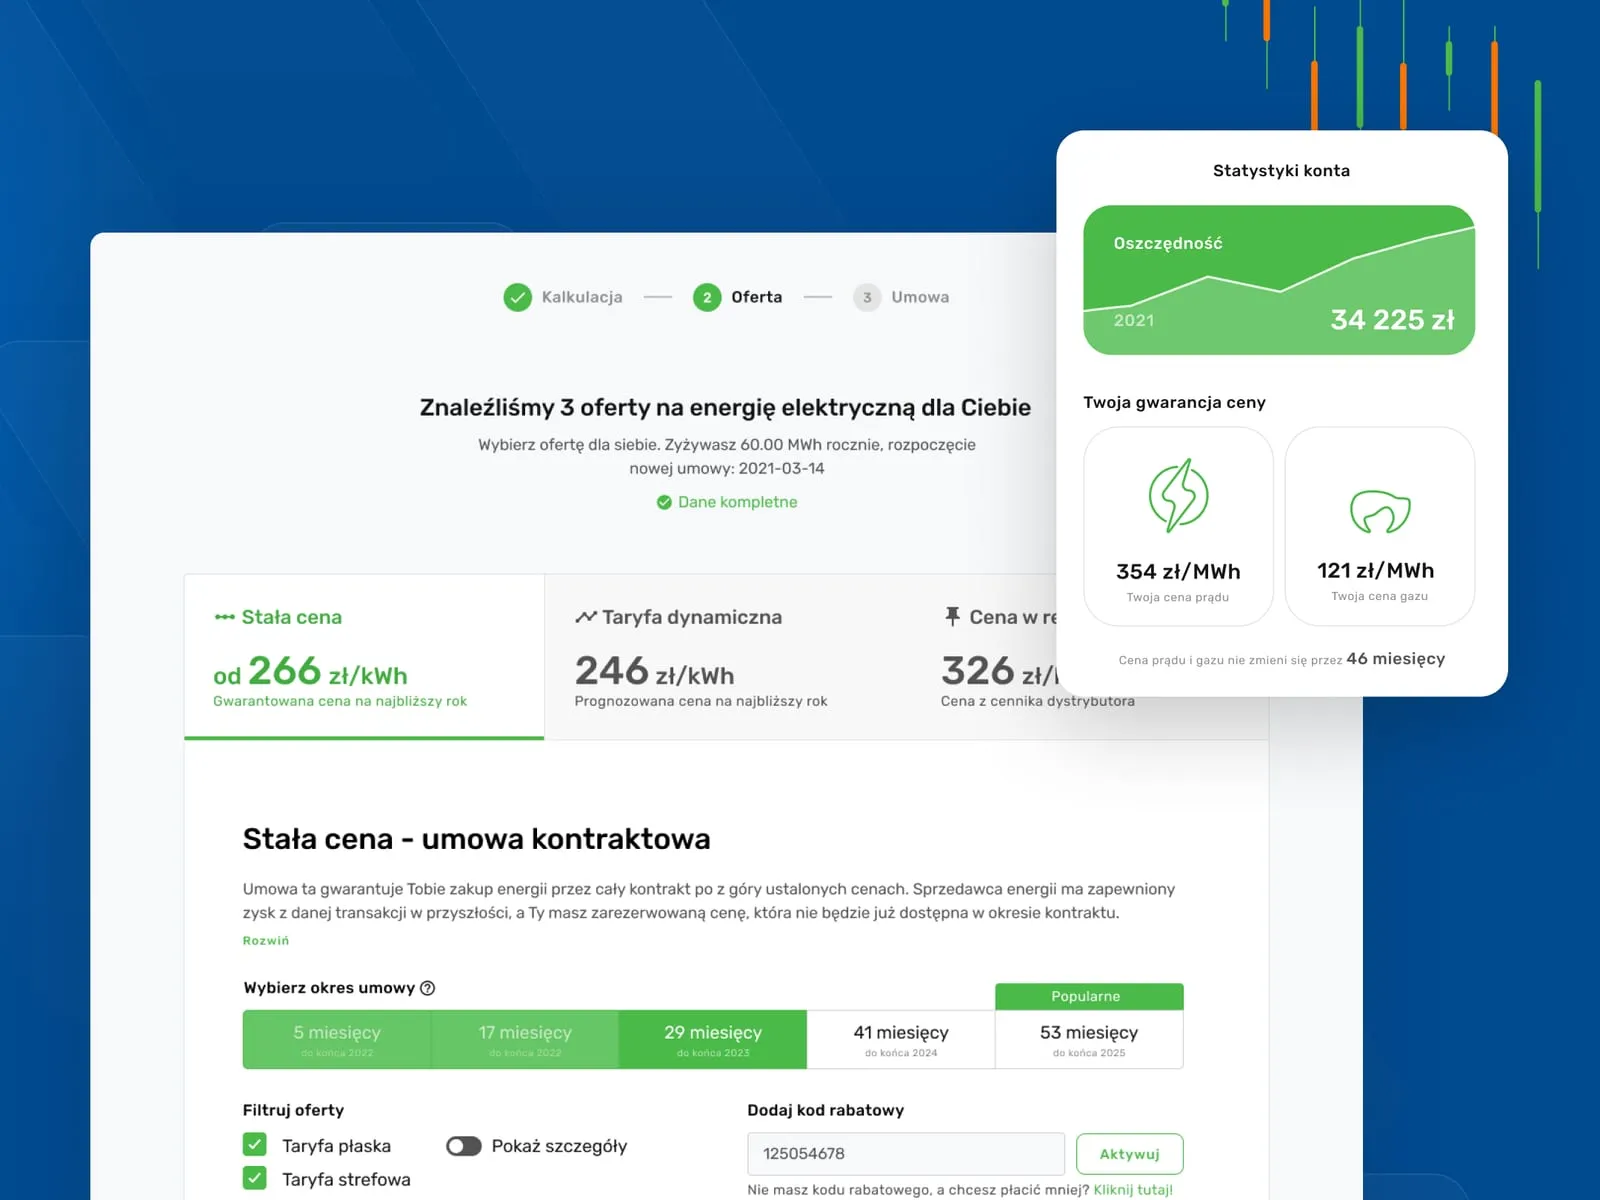
Wolumen
Energy and gas price comparison for businesses
-
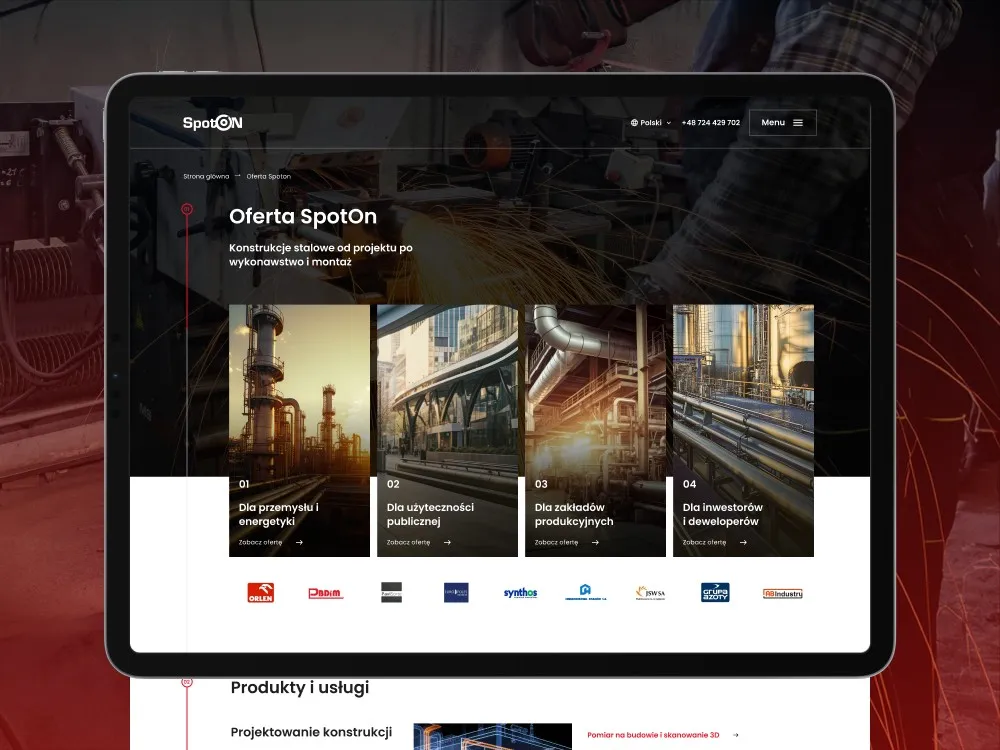
SpotOn
Website for a steel-structures manufacturer
-

SpotOn
Visual identity for a welding company
-

Lavaster
Promotional brochure for steel chimney maker
- See what else we build Projects
Start your energy software project
The customer portal, the quote calculator and the dispatcher panel are designed by one team, which then oversees the build.

Client voices
What our clients say

“Working with the UX agency Wzór on the NXC Liquid Cooling website went remarkably smoothly and professionally. The team stands out for its excellent, partner-like approach and its flexibility at every stage of the work. A major advantage was designing directly in code, which significantly shortened the time to launch while ensuring excellent technical and visual quality of the site. The end result meets our expectations 100%. I wholeheartedly recommend Wzór as a reliable partner.”
 Jonasz Więcławski Chief Executive Officer, Wolumen
“The new quote generator on our site is more convenient for users and looks far better. Despite the tight deadline, Wzór UX Agency rose to the occasion. Soon after launch we noticed higher conversion and a lower load on our Customer Service Office, and that was crucial for us. We wholeheartedly recommend Wzór.”
 Daniel Sydorowski President of the Board, Spot-On Welding Sp. z o.o.

“Our website, catalogs, sales offers, leaflets, car wraps. Everything our client sees goes through UX Agency Wzór. One team, one standard, zero effort on my side to keep things consistent. We have been working together since 2022, and that is probably the best recommendation I can give.”






























The team
Who will design your energy software?
-

Aleksandra Bondar
Senior UX/UI Designer
View profileHow can I help you?
“I will design the customer portal from meter reading to invoice and check with customers that they understand what they are paying for.”
-
Patryk Korycki
CEO, Analityk Biznesowy
View profileHow can I help you?
“I will agree the scope and order of work with you, and during the build I will see to the connections with billing, meter data and CSIRE.”
-

Katarzyna Adamczuk
Prezes, Analityk Biznesowy
View profileHow can I help you?
“I will work out what makes up each line of the invoice, meaning reading, tariff, estimate and correction, so that what customers see online matches the billing system.”
-

Tadek Wadas
Senior UX/UI Designer
View profileHow can I help you?
“I will test the outage board with dispatchers on a night-storm scenario, and the micro-installation notification form with solar installers.”
FAQ
Frequently asked questions about energy software
What is a utility customer portal (e-BOK)?
A utility customer portal, called e-BOK in Poland, is the energy supplier's online service where customers check invoices and consumption, submit meter readings, pay bills and raise issues without visiting a branch. Suppliers run it on their website and in a mobile app, often under their own brand name. Our starting point is the set of issues customers phone the helpline about today, because those show what is missing.
What is CSIRE?
CSIRE, the Central Energy Market Information System, is the system through which, since 1 July 2025, energy suppliers and operators have exchanged information on the Polish retail electricity market, including data for switching supplier and the metering data needed for billing. It is run by Polskie Sieci Elektroenergetyczne as the energy market information operator, and market participants join it in stages. Electricity users check their own data in the Moje IRE portal, logging in through login.gov.pl.
What is a billing system in the energy sector?
A billing system in the energy sector calculates and issues invoices for energy and distribution based on the contract, the tariff and the meter readings, and it also stores customer data. Billing departments and customer service consultants work in it, and the customer sees its output on the invoice and in the customer portal. Our part is the screens where a consultant explains a settlement, and the invoice view people get online.
What is a SCADA system in the energy sector?
A SCADA system in the energy sector collects data from grid equipment and lets the dispatcher control it remotely, and together with ADMS it supports running the network and restoring supply after outages. The dispatcher works in it for the whole shift. The control core is not ours to design: we work on the views used by the people around the dispatcher, from field crews to helpline consultants.
How does net-billing work?
Net-billing is a settlement system for prosumers introduced in Poland on 1 April 2022, under which the energy a prosumer produces is settled by value, ultimately at day-ahead market prices. In a prosumer app we show the energy fed into the grid and its value in zloty side by side.
What is a smart meter?
A smart meter is an electricity meter that sends consumption data to a remote reading system by itself, so nobody has to read it on site. Distribution system operators have a statutory obligation to install such meters for most customers. Submitting a meter reading by hand is then no longer needed.
Can you change billing system screens without replacing the system?
The screens consultants work on can be changed without replacing the billing system when the new view pulls data through an interface and the same system keeps calculating the bills. What changes is the layout and the order of information, while the charging rules stay as they are. We list changes to the rules themselves separately, as work for the system vendor.
How do you notify a micro-installation online?
A micro-installation is notified through an online form on the website of the distribution system operator whose grid the building is connected to, with the installation and inverter details and the installer's declaration. The operator verifies the notification, and the case status can usually be checked in the same service. In the notification forms we design, the list of required attachments changes with what the investor has entered about the installation.
How long does it take to design an energy price calculator?
The UX/UI design of the energy price calculator in the Wolumen comparison service took two of our designers four weeks and covered 64 app screens. We confirm the timeline of the next project once we know the scope: the number of offers, the types of clients and the steps to a signed contract.
Related services
Services related to energy software
You know users get lost in your self-service portal or quote calculator.
Let us start by finding the point on the journey where people stop.
You are planning to replace your billing system or build a new portal.
We will work out what the helpline, the billing team and the control room need before you choose a vendor.
You have screen designs and want to try them out with customers or dispatchers.
We will talk them through with you or prepare a prototype for testing with the people who will use it.